Dashboard
MaaS (Monitoring as a Service)
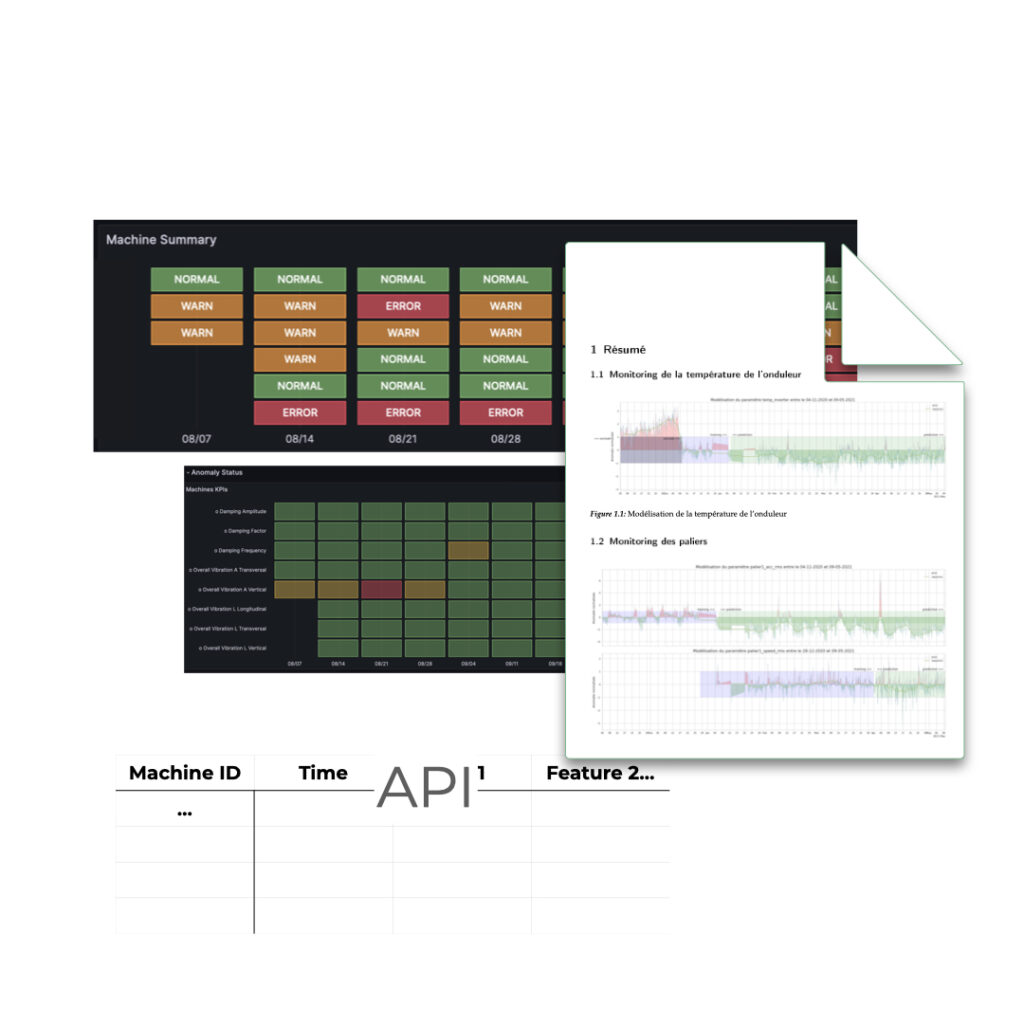
The KPIs calculated by the Analytics Platform MoonStone Insight are published:
- via an automatic report (sent to the user in a PDF format) or
- digitally over an API for visualization with 3rd party systems or
- with GradeSens MoonStone Dash .
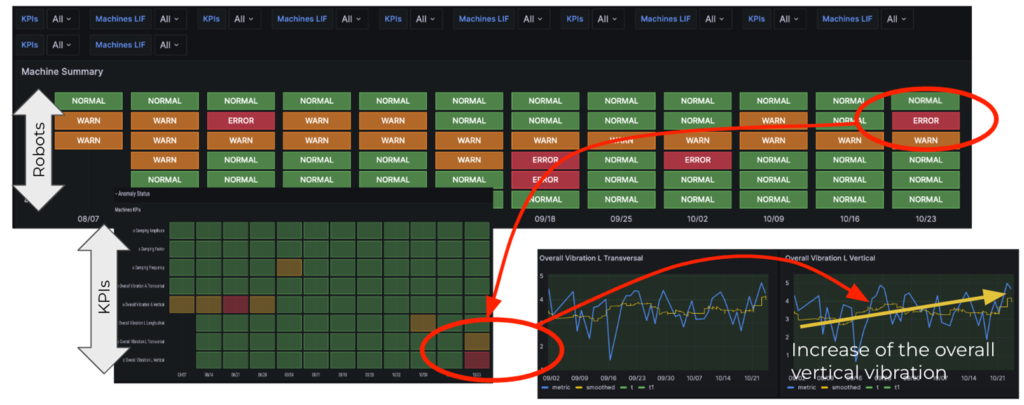
MoonStone Dash is our turnkey cloud solution able to visualize the KPI trends for each system and site. the dashboard is designed with a standard set of visualisation so that it can be deployed automatically for each production site.
Data Management
- Data managed per site, section, machine and measurement point.
- Sensors’ data connected to each measurement point so that data continuity is ensured even in case of sensors replacement.
- Full remote configuration of LYRASens (e.g. acquisition parameters) and LYRAGate.
- Remote firmware upgrade of LYRASens and LYRAGate.
- LYRA infrastructure monitoring (e.g. batterie voltage, RSSI,…).
Data Visualisation
- Trend view of data
- Analysis view of raw data in time and frequency spaces (FFT, wavelets, hilbert)
MoonStone dash
- Standard dashboard with automatic deployment on multi-machines and multi-sites
- Cloud installation
- Alarming & notifications